
Your BI Dashboards Don’t Agree: Fix Metric Drift and Read Storms with Governed Data Products (Elementrix + Analytics)
If your Power BI dashboard reports one number and Tableau reports another, you don’t have a visualization problem. You have a governed data delivery problem. The same root cause appears when analysts export to spreadsheets because access takes too long, or when data scientists rebuild datasets in notebooks because the “official” version can’t be trusted.
The failure mode is consistent: analytics consumption scales faster than governance. Teams respond by duplicating datasets, redefining metrics inside tools, and allowing direct reads from operational systems. Over time, you get metric drift, access chaos, and performance incidents driven by BI concurrency.
The integration pattern in this use case is designed to stop that cycle. Elementrix sits between BI/analytics consumers and upstream systems of record to deliver governed data products with consistent KPI definitions, self-service access requests, policy enforcement, auditability, and decoupled high-performance reads.
What breaks in analytics at scale
Most organizations can describe the symptoms in one sentence: “We can’t agree on numbers, and we can’t control access without slowing everyone down.”
Here is what that looks like day-to-day:
- Metric drift: “Net Revenue” is calculated differently in different dashboards.
- Shadow distribution: extracts move around in email/Sheets because governed access is slow.
- Uncontrolled access paths: the same data is reachable through multiple routes with inconsistent masking and row filters.
- Read storms: BI tools hammer operational databases during peak hours, degrading production performance.
- Low trust: teams stop believing dashboards, and the organization reverts to manual reconciliation.
These are not BI tool shortcomings. They’re architecture and operating-model shortcomings.
The solution pattern: Elementrix as the governed data delivery layer for analytics
The core idea is to stop treating analytics as “everyone connects wherever they can,” and instead treat analytics consumption as “everyone consumes governed products through a controlled delivery layer.”
In this pattern:
- BI tools and notebooks remain the consumer experience.
- Elementrix becomes the policy enforcement and delivery layer.
- Upstream systems are protected by asynchronous synchronization.
- Consumers get multiple “views” of the same product without multiplying datasets.
This creates a single, repeatable path for trusted insights.
The architecture in one minute
Elementrix sits in the middle of two sides of the system.
On the left are analytics consumers:
- BI dashboards (Power BI, Tableau, Looker)
- Data analysts (SQL, notebooks)
- Data scientists (exploration, feature work)
- Executive reporting (KPIs)
On the right are upstream systems of record:
- ERP, CRM, operational databases
- Mainframes/legacy systems
- Static files, and optionally event streams
Elementrix connects to upstream systems through an out-of-band sync process (asynchronous replication / near-fresh). This is the key to preventing BI tools from hitting production systems per query.
Optionally, governed data products can be published downstream into a warehouse/lakehouse or metrics store for historical analytics—without losing the governed definitions.
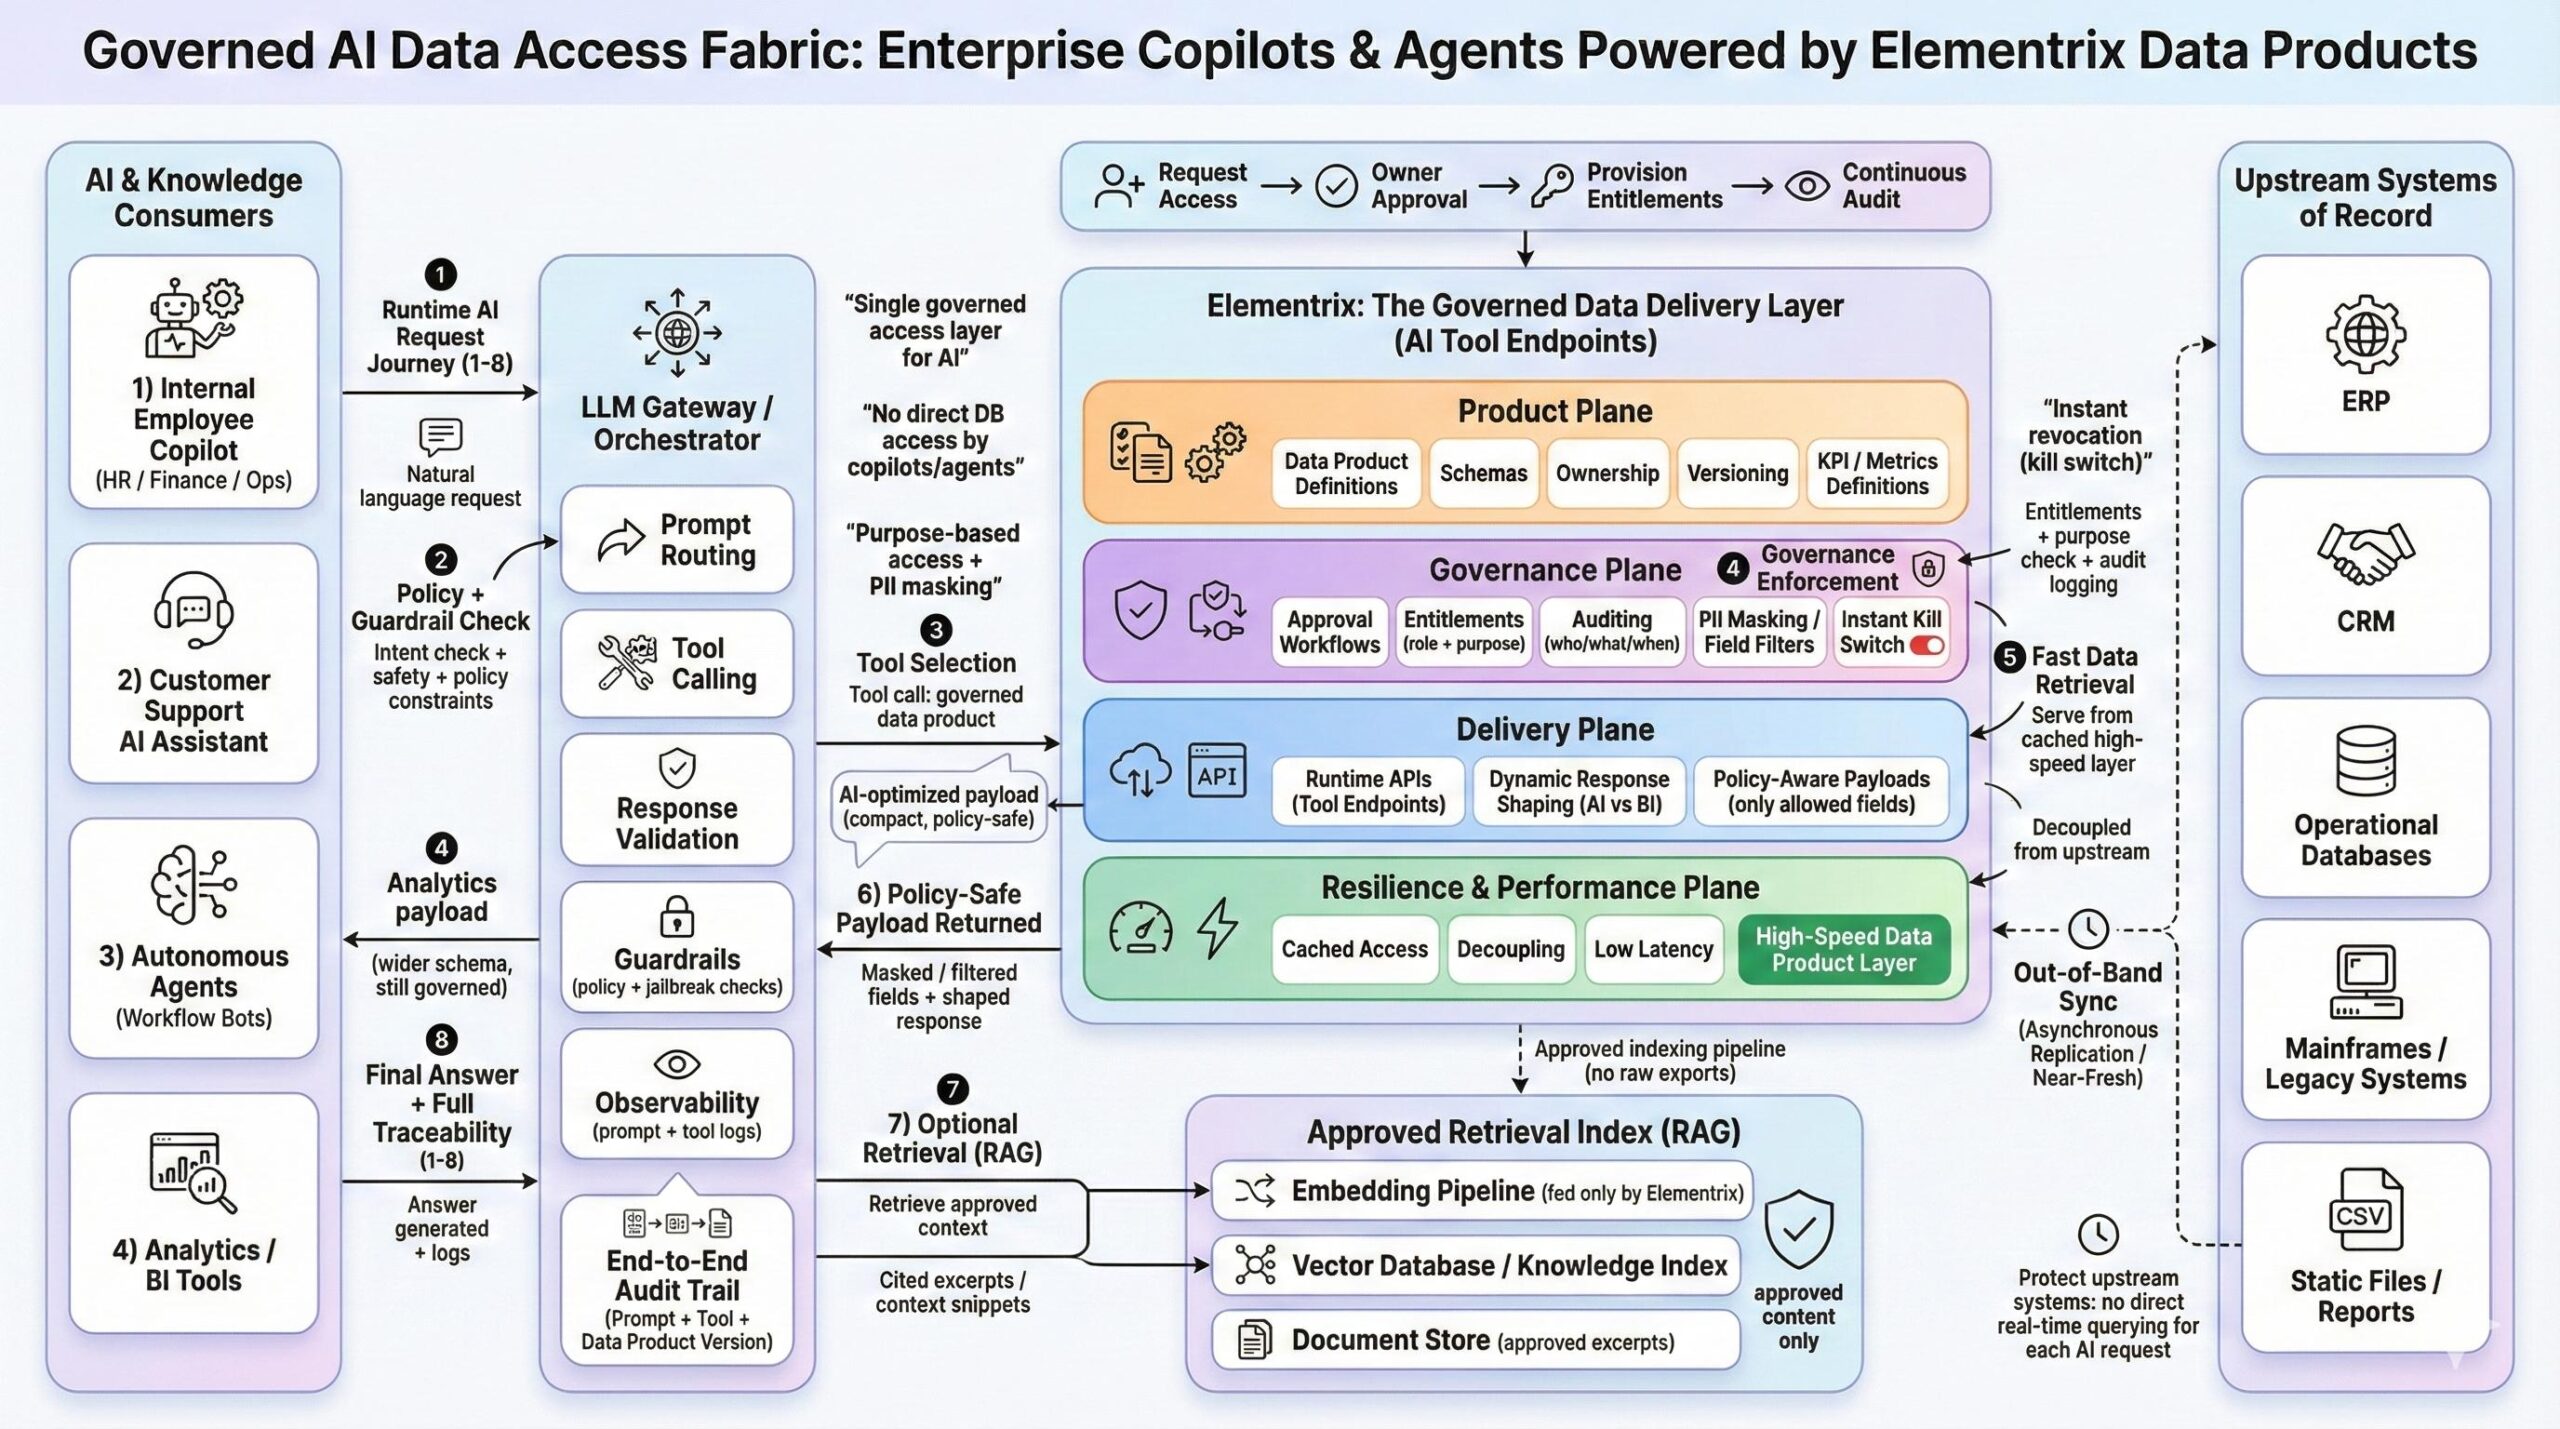
How Elementrix works: the four planes
Elementrix is easiest to understand as four planes that work together.
Product plane: define what “trusted” means
This is where teams create a data product with a clear contract.
- Product definition and schema
- Ownership and stewardship
- Versioning and deprecation rules
- Metrics glossary and KPI definitions
The practical outcome is that KPIs stop being “dashboard logic” and become governed assets.
Governance plane: scale access without losing control
This plane turns governance into an operational system rather than a manual process.
- Self-service access requests
- Approval workflows
- Entitlements (role-based + purpose-based)
- Policy rules (PII masking, row-level filters)
- Audit trail (who accessed what, when)
- Instant kill switch for rapid revocation
The goal is to reduce backchannels while increasing accountability.
Delivery plane: serve analytics safely at runtime
This is where consumers retrieve data through governed endpoints.
- Analytics APIs or SQL-like access endpoints
- Dynamic response shaping per tool/persona
- Query guardrails to enforce policy and prevent runaway use
The key idea is “one governed product, multiple governed analytics views,” without cloning datasets.
Resilience & performance plane: stop read storms
This plane makes analytics performance predictable.
- Cached access
- Decoupled reads
- Low latency via a high-speed data product layer
Operational systems stop being the bottleneck for interactive analytics.
The end-to-end journey (how analytics users interact)
Analytics consumption in this model follows a clean lifecycle. Each step is simple, but the combination is what removes drift and risk.
1) Discover a data product
Instead of searching for tables, users discover a governed product in a marketplace/catalog. They can see the schema, owner, version, and KPI definitions.
Why it matters: discovery becomes standardized, and ownership becomes explicit.
2) Request access (self-service)
Users request access through a workflow rather than informal channels. Requests are trackable, approvable, and auditable.
Why it matters: access becomes fast enough to prevent bypass behavior.
3) Sync upstream data out-of-band
Elementrix maintains near-fresh availability through asynchronous replication. BI tools do not hit upstream systems per query.
Why it matters: read storms stop impacting production systems.
4) Enforce governance consistently
At runtime, Elementrix applies the same policy framework across tools and personas.
- Entitlements determine whether access is allowed.
- PII masking ensures sensitive fields are never leaked.
- Row-level filters enforce regional/tenant/business-unit constraints.
- Audit trails record who accessed what.
- Kill switches provide immediate shutdown for risky access.
Why it matters: governance becomes uniform rather than tool-specific.
5) Query through governed endpoints
Consumers retrieve what they need through controlled access modes that align with how analytics work.
Common views include:
- An aggregated KPI view for dashboards
- A wider exploration dataset for analysts
- A feature-ready dataset for ML work (approved fields only)
Why it matters: you avoid proliferating “gold tables” while still meeting different needs.
6) Serve from a high-speed data product layer
Reads are cached and decoupled for predictable latency, even with concurrency spikes.
Why it matters: analytics stays interactive without operational risk.
7) Optionally publish downstream for historical workloads
For long-term analytics, governed products can be published to a warehouse/lakehouse or metrics store while retaining product definitions and governance context.
Why it matters: “trusted” stays trusted as it scales into historical and batch use cases.
What developers actually implement
This pattern is not conceptual. It translates cleanly into implementation tasks across product definition, governance, delivery, and sync.
1) Define the data product contract
You define schema, ownership, versioning, and freshness expectations.
dataProduct:
name: SalesPerformance
version: v1
owner: “Commercial Domain”
steward: “Analytics Owner – Revenue”
freshnessSLA: “≤ 5 minutes”
schema:
order_id: string
customer_id: string
order_date: date
region: string
channel: string
net_revenue: number
gross_margin: number
2) Define KPI glossary entries (single source of truth)
KPI logic becomes governed and reusable across BI tools.
kpiDefinitions:
– name: NetRevenue
definition: “Sum of invoiced revenue minus discounts and returns.”
grain: “order”
filters: “Exclude cancelled orders”
– name: GrossMarginPct
definition: “(NetRevenue – COGS) / NetRevenue”
grain: “order”
3) Configure governance policies
Policies cover entitlements, row filters, masking, and auditability.
accessPolicy:
product: SalesPerformance:v1
consumer: “BI-Commercial-Users”
purpose: “commercial_reporting”
approvalRequired: true
rowFilters:
– “region IN user.allowed_regions”
piiMasking:
– field: customer_id
rule: “hash”
audit: true
killSwitch:
enabled: true
4) Build the out-of-band sync path
The sync strategy depends on your sources:
- CDC replication for transactional databases
- Scheduled extracts when CDC is not possible
- File-based ingestion for legacy/SaaS exports
What matters most is instrumentation: lag monitoring and freshness compliance become operational metrics.
Why this pattern improves outcomes quickly
The benefits are concrete and usually visible early.
- KPI consistency improves because definitions stop living inside dashboards.
- Access becomes faster and safer, reducing spreadsheet backchannels.
- Production systems are protected because BI tools no longer read them per query.
- Governance becomes tool-agnostic because policies are enforced in one delivery layer.
- Performance becomes predictable because caching and decoupling are designed in.
Developer Checklist Appendix
Use this checklist as a practical implementation guide.
Product plane
- Define data products with owner, schema, grain, freshness SLA
- Establish KPI glossary entries with shared definitions
- Implement versioning and deprecation policies
Governance plane
- Enable self-service access requests and approval workflows
- Configure entitlements (role + purpose)
- Apply PII masking and row-level filters
- Turn on audit logging and operational review processes
- Define kill-switch authority and incident procedures
Delivery plane
- Provide analytics APIs or SQL-like endpoints for BI and notebooks
- Implement dynamic response shaping (KPI vs exploration vs feature-ready)
- Add query guardrails (row caps, timeouts, field limits, concurrency controls)
- Standardize policy-denial behavior and error envelopes
Resilience & performance plane
- Configure caching strategy per product (TTL, invalidation, SLO alignment)
- Ensure no direct BI reads against operational databases
- Load test concurrency patterns (morning spikes, month-end)
- Instrument logs, metrics, and traces end-to-end
Out-of-band sync
- Select sync approach per source (CDC/extract/file)
- Monitor replication lag and freshness drift
- Define behavior during sync degradation (serve stale vs fail closed)
- Add post-sync data quality checks (null spikes, row count drift)