
If your Power BI dashboard shows one number and Tableau shows another, you do not have a dashboard problem.
You have a single source of truth for analytics problem.
This usually starts small. A team redefines “Net Revenue” inside one BI tool. Another team exports data to spreadsheets because governed access takes too long. Data scientists rebuild datasets in notebooks because the “official” version is incomplete or hard to trust.
Over time, the result is familiar:
- BI dashboards do not match
- KPI definitions drift across teams
- access requests move through side channels
- analysts create shadow datasets
- production systems get overloaded by direct BI reads
This is not a visualization issue. It is a data governance for analytics issue.
The fix is not another dashboard rebuild.
The fix is to standardize analytics through governed data products delivered through a controlled, auditable layer.
That is where Elementrix fits.
Elementrix is designed to help enterprises treat data as a product, enforce ownership and lifecycle controls, centralize access governance, and deliver governed data through a secure abstraction layer between consumers and backend systems.
What is a single source of truth for analytics?
A single source of truth for analytics means the business does not have to debate which number is correct every time a decision matters.
A trusted single source of truth gives teams:
- shared KPI definitions
- a consistent schema and contract
- governed access rules
- clear ownership
- auditable consumption paths
In practical terms, it means your executives, analysts, and BI tools are working from the same governed logic instead of recreating metrics in multiple places. The broader concept of a single source of truth is well established in analytics and enterprise data management because it reduces conflicting reports and improves decision-making consistency.
Read more : Build an Internal Data Marketplace with Governance
Why BI dashboards show different numbers
When BI dashboards disagree, the cause is usually architectural, not cosmetic.
Here are the most common reasons:
1. KPI logic lives inside dashboards
One team calculates revenue after returns. Another excludes cancelled orders. A third applies different regional filters.
Now everyone has a dashboard, but nobody has a trusted metric.
2. Teams duplicate data to move faster
When governed access is slow, people bypass the process. They export extracts, circulate spreadsheets, and create local versions of business-critical datasets.
3. The same data is exposed through multiple access paths
One team uses a warehouse table. Another pulls directly from an operational database. Another consumes an API with different field-level rules.
4. BI tools hit production systems directly
At scale, concurrency spikes from dashboards and ad hoc queries create read storms that affect application performance and operational stability.
5. Ownership is unclear
If nobody owns the metric contract, it eventually gets redefined wherever it is consumed.
This is how metric drift becomes normal.
Read more : Fix API Sprawl with Modern Data Governance
What causes metric drift in analytics?
Metric drift happens when the same KPI is calculated differently across dashboards, teams, tools, or time periods.
It usually appears when:
- metric definitions are not centrally governed
- dashboard logic becomes the source of business meaning
- teams copy and modify datasets for local use
- access paths are fragmented
- semantic definitions are not reused consistently
Once that happens, your dashboards may still look polished, but they stop being trusted.
Read more : API Performance Optimization: How to Prevent Read Storms
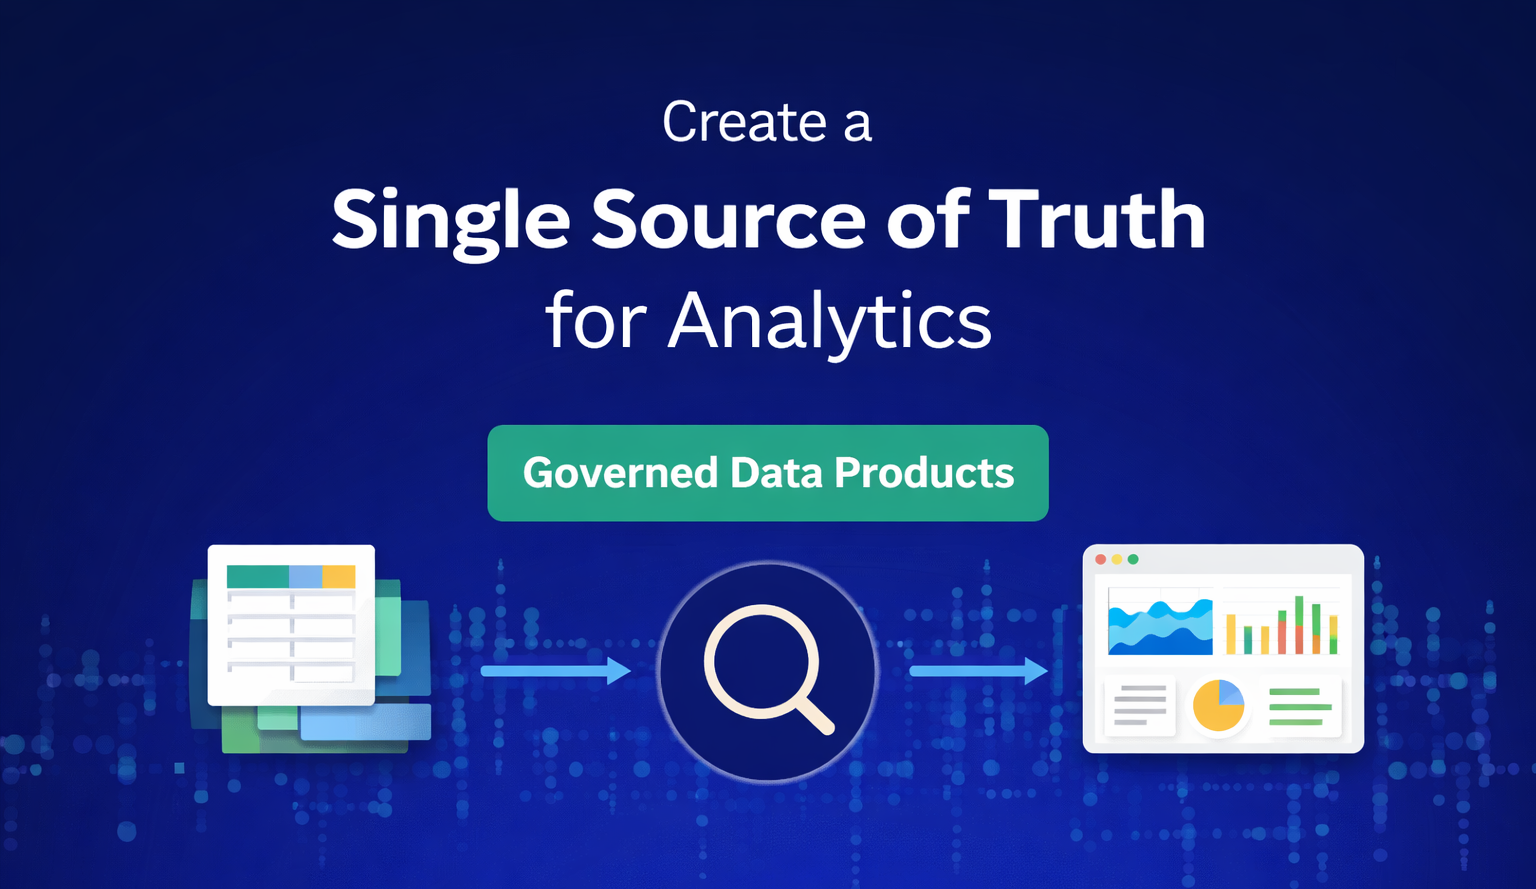
The better pattern: governed data products for analytics
The more scalable approach is to stop treating analytics as “everyone connects wherever they can.”
Instead, treat analytics as a governed consumption model built on data products.
In this model:
- BI tools remain the front-end experience
- analysts and data scientists still use SQL and notebooks
- upstream systems remain the systems of record
- a governed delivery layer standardizes how data is exposed
Elementrix supports this model by enabling discoverable, governed data products with ownership, lifecycle management, access workflows, and policy-based delivery.
How governed data products create a single source of truth
A governed data product is not just a dataset.
It is a reusable analytics asset with:
- a defined schema
- named owners and stewards
- consistent KPI definitions
- versioning rules
- access controls
- auditability
- delivery interfaces for governed consumption
This changes the operating model in a big way.
Instead of every team rebuilding “Customer Revenue” in its own stack, the organization publishes one governed product and allows different consumers to retrieve the views they need under policy.
That is how you create a single source of truth for analytics without forcing every user into the same tool.
Read more : Governed Data Products: The Enterprise Model for Controlled Data Delivery
How Elementrix standardizes analytics delivery
Elementrix works as a governed data delivery layer between analytics consumers and upstream systems. Its platform positioning emphasizes governed data products, discovery, access workflows, policy enforcement, and a secure abstraction and caching layer that decouples front-end consumption from backend systems.
In practice, that supports four critical outcomes.
1. KPI standardization
Business logic moves out of dashboards and into governed data products.
That makes KPI definitions reusable across Power BI, Tableau, Looker, notebooks, and executive reporting.
2. Self-service data access with control
Users discover products, request access, and move through an approval workflow instead of relying on Slack messages, email threads, or informal handoffs.
3. Policy-based access enforcement
Access is governed by role, purpose, and policy. Sensitive fields can be masked, row-level filters can be applied, and access can be audited.
4. Decoupled reads for performance
Analytics traffic can be served through a decoupled, high-performance layer rather than hammering operational systems directly.
How do you enable self-service analytics without losing governance?
This is one of the biggest questions enterprise teams ask.
The answer is: do not remove governance.
Make governance operational.
A scalable self-service analytics model needs:
- discoverable data products
- approval workflows
- role-based and purpose-based entitlements
- field-level policy enforcement
- audit logs
- fast delivery after approval
When governed access becomes easier than bypassing it, user behavior changes.
That is the difference between “governance as friction” and “governance as the default path.”
How do you prevent BI tools from overloading production databases?
You do it by separating analytics reads from operational runtime dependency.
Instead of letting every dashboard query an application database directly, you create a governed analytics delivery path with:
- asynchronous or out-of-band synchronization
- decoupled reads
- caching where appropriate
- query guardrails
- controlled downstream publishing for historical workloads
That protects systems of record while preserving analytics performance.
This pattern aligns closely with Elementrix’s positioning as a secure abstraction and caching layer that improves performance and decouples consumers from backend systems.
What is the difference between data access and data exposure in analytics?
This matters more than many teams realize.
Granting access to a dataset should not automatically mean exposing every field to every consumer.
A mature analytics model separates:
- who can access the product
- which fields they can see
- for what purpose
- for how long
- under which approval path
- with what audit trail
That distinction is essential if you want governed analytics, audit readiness, and least-privilege enforcement.
A practical implementation model
Here is a simple way to think about implementation.
Step 1: Define the data product contract
Establish the schema, ownership, grain, freshness expectations, and lifecycle.
Step 2: Standardize KPI definitions
Create a shared glossary for critical metrics such as revenue, margin, churn, active customer, or policy conversion.
Step 3: Add governance workflows
Make access requests trackable, approvable, and auditable.
Step 4: Enforce policy centrally
Mask sensitive fields, apply row filters, and standardize entitlement logic.
Step 5: Deliver multiple governed views from one product
Dashboards may need aggregated KPI views. Analysts may need wider exploration datasets. ML teams may need approved feature-ready views.
Step 6: Decouple analytics reads from production systems
Serve analytics through a high-performance delivery layer instead of direct runtime reads.
Signs your organization needs this now
You likely need a better analytics governance model if:
- different dashboards show different numbers
- business teams no longer trust KPIs
- analysts spend time reconciling reports manually
- spreadsheets are moving through email
- access approvals are inconsistent
- production databases slow down during BI peaks
- teams keep creating duplicate extracts and “gold tables”
If this sounds familiar, the issue is not a lack of dashboards.
It is the lack of a governed path to trusted analytics.
Why this matters for AI readiness too
AI systems do not fix inconsistent data definitions. They amplify them.
If your governed metrics are weak, AI-generated analysis will still inherit the same contradictions.
A stronger single source of truth for analytics helps with more than BI. It improves the quality of downstream AI, copilots, and decision-support systems because they can anchor to certified metrics and governed access paths instead of fragmented logic.
Final takeaway
You do not solve dashboard disagreement by redesigning charts.
You solve it by creating a single source of truth for analytics built on governed data products, standardized KPI definitions, policy-based access, and decoupled delivery.
That is the shift from dashboard sprawl to trusted analytics.
If you want to see how this works in practice, explore Elementrix and see how governed data products, access workflows, and secure delivery can help standardize analytics across your enterprise.
Visit Elementrix to learn how to create governed data products, reduce metric drift, and deliver trusted analytics without overloading your source systems.
FAQ
Why do BI dashboards show different numbers?
Because KPI logic often gets redefined across dashboards, teams, and tools. Without governed definitions, the same metric can produce different outputs in different environments.
What is a single source of truth for analytics?
It is a governed model where teams rely on the same KPI definitions, contracts, and access rules to make decisions from trusted data.
What causes metric drift?
Metric drift happens when business logic is recreated in multiple tools, datasets are duplicated, and definitions are not centrally governed.
How do governed data products help?
They standardize ownership, schema, metric definitions, access policy, and consumption paths so analytics stays consistent across teams.
How do you support self-service without losing control?
By combining discoverability, workflow-based access requests, policy enforcement, and auditability in one governed delivery model.
How does Elementrix help?
Elementrix provides a governed data platform centered on data products, lifecycle controls, access governance, discovery, and secure delivery between consumers and upstream systems.